NEW DATA VISUALIZATIONS: See disparities in voter registration between 18-year-olds and 45+. Compare across states and counties. Take action!
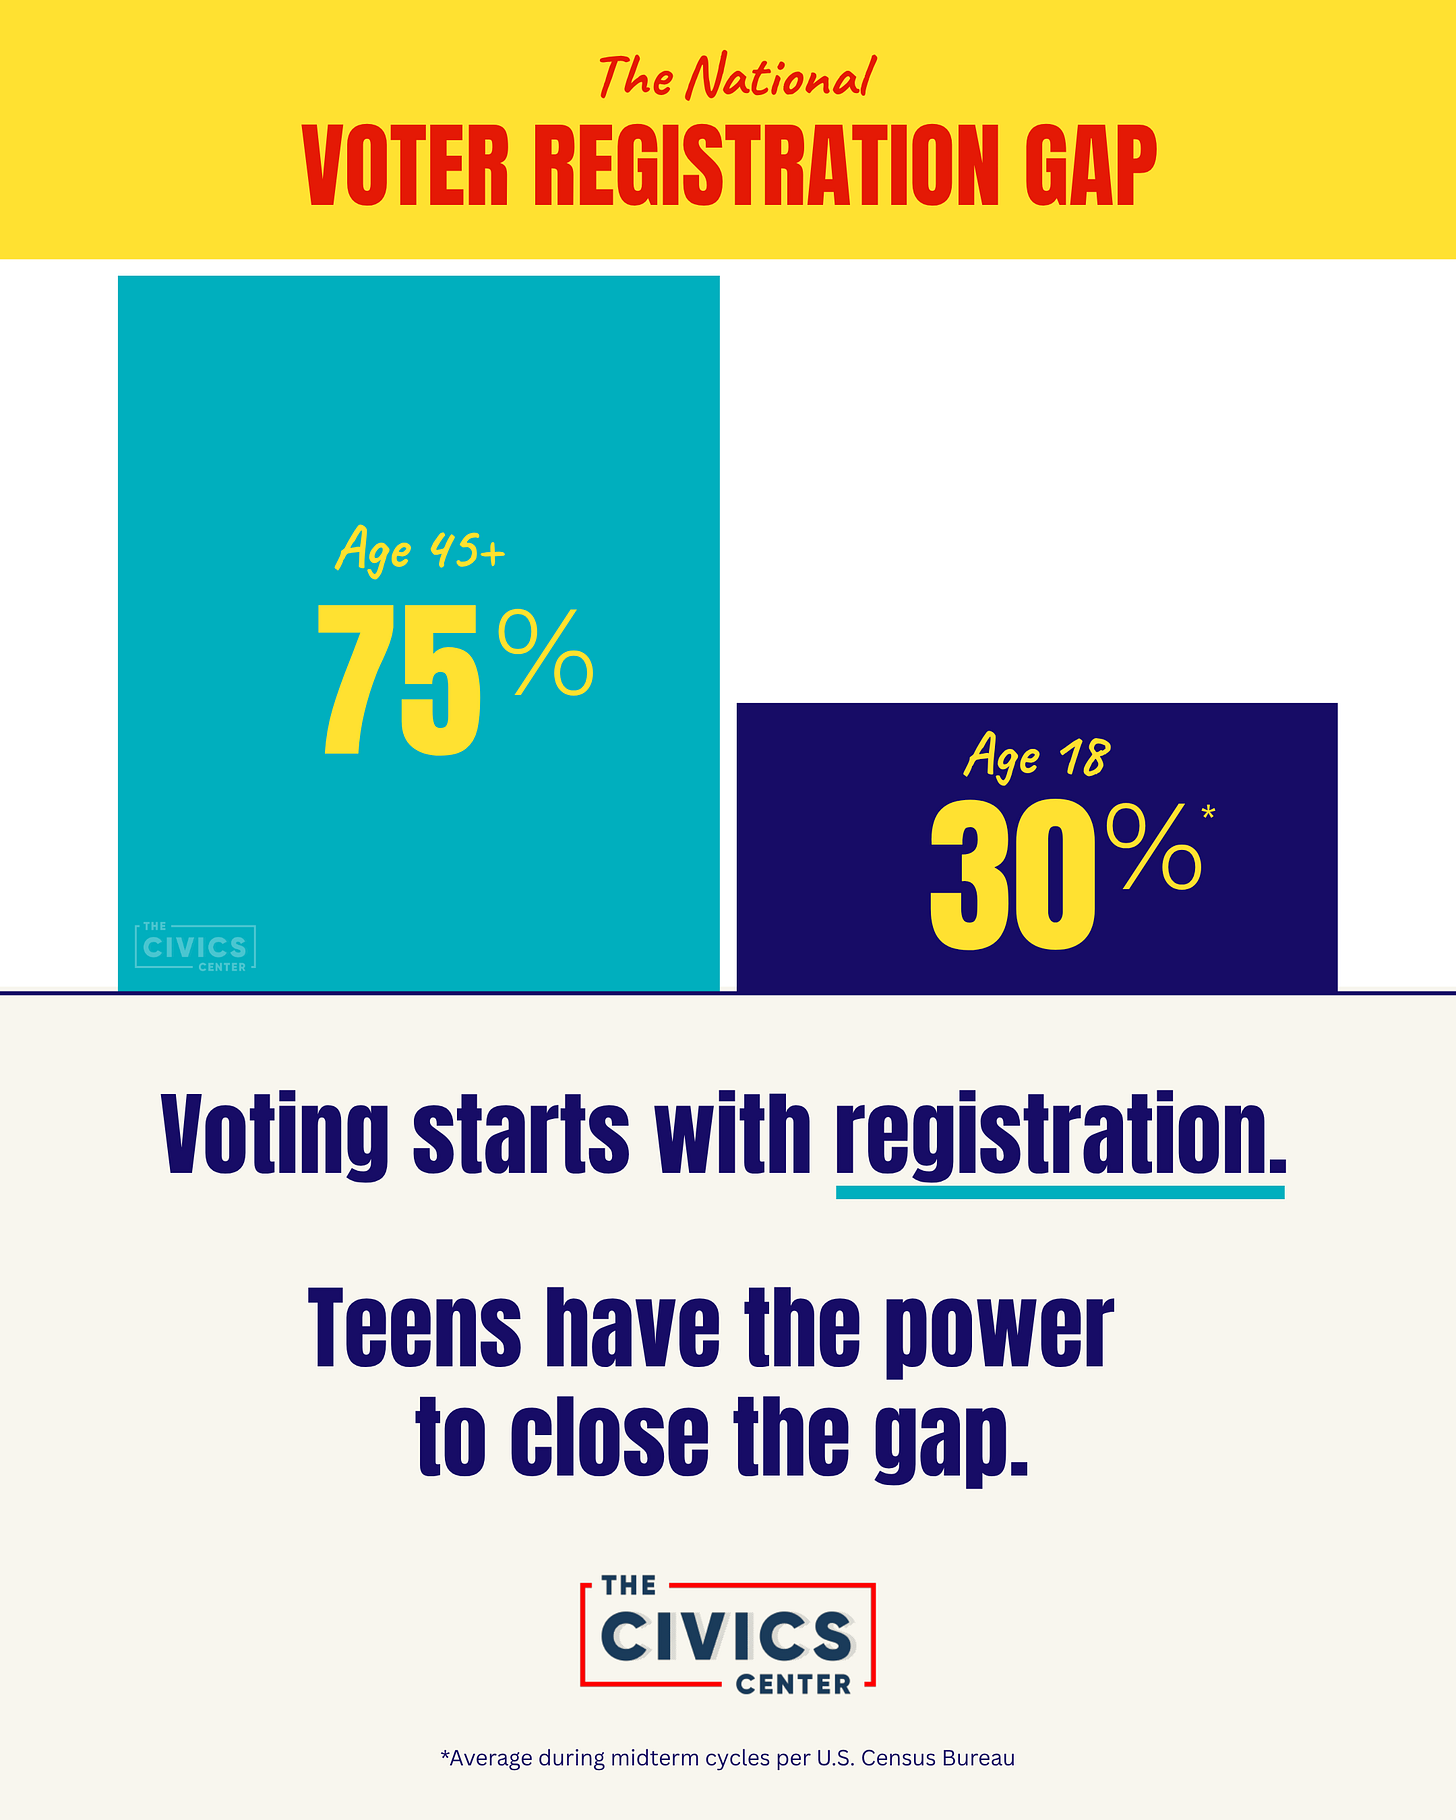
Nationally, under 30% of 18-year-olds are registered to vote compared to 75% of voters 45+. We call this The Voter Registration Gap. And teens have the power to close it.
One of the greatest challenges our democracy faces is the gap in voter registration rates between young voters and older Americans. It has amounted to disenfranchisement of young voters by the millions, cycle after cycle, decade after decade, all across America.
We call this The Voter Registration Gap.
Until now, this problem has remained largely unreported and hidden from view. Instead of reliable data, we’re treated to assumptions, like young people are apathetic or existing systems are adequate. But the reality is different. Young people are largely ignored, not apathetic. Existing systems such as digital-only efforts and Motor Voter are missing millions. College programs are great, but 40% of teens do not go to college. There has to be a better way.
So I developed a novel method for showing the gaps, on the idea that once we can see the problems, we can get to work on making effective changes. The method estimates voter registration rates of 18-year-olds and other age-defined populations at the most local level available: school districts, cities, counties. With the team at TCC and a team of outside experts, we developed these visualizations to show you the numbers, highlight the disparities, point out opportunities, enable you to take action to make change in your community. We can track changes over time so you can see your efforts at work.
Today, the gap in registration rates between young voters and older Americans is enormous. But it does not have to be this way; young people have the power to work together and close the gap in their communities. And the rest of us can help them.
You will notice vast disparities among – and within – states, which helps to localize the problem, and spotlight the policies that have lead to differing outcomes.
A growing body of research says that many young people have lost faith in democracy. But, for all of the flaws in US democracy today and the erosion of institutions that support it, the promise of democracy is that it has the ability to self-correct. But that’s not automatic. It depends on us. It depends on our capacity to make this real for the up-and-coming generation and for them to make it real for themselves.
The data pose urgent questions for everyone who cares about democracy, about young people, and about the United States: How do we build systems, practice, and leadership to make our democracy stronger?
How do we welcome and engage the youngest voters as soon as they are old enough, ensure they will have an equal voice, and recognize that “We the People,” belongs to them?
These are big goals for maps, bar charts, and other data visualizations. But I have been working to illuminate the problem of low youth political participation through data since 2017, and one theme has remained constant:
When young people and their school communities see reliable data showing how our current voter registration systems have missed them, they become curious and engaged in solving the problem.
When Pennsylvania and Ohio teens see that they are radically under-registered compared to their peers in North Carolina and Michigan, they realize that the power to make change is in their hands.
We also want to raise awareness among every other stakeholder:
When school district officials and school leaders understand the problems, they can provide policy and administrative support to require training and implementation of high school voter registration and civic engagement programs.
When parents understand the problems, they can help their teens overcome the barriers that block them out, guiding them through the official forms that most students have never seen.
When state and local election officials understand, they can review their systems and programs to better collaborate with high schools and to serve the needs of future voters.
When governors and state legislatures understand, they can create more effective legislative solutions.
When organizations serving students and educators understand, they can build on their existing relationships of trust to help their communities see their role in democracy.
When authors, advocates and analysts understand, they can bring the issues to wider audiences. They can include youth voter registration as a key pillar of a pro-democracy agenda.
When donors understand and come to appreciate the types of interventions that work best – because we can actually track community-level data and progress – we can open the door for a virtuous cycle in which funding is directed to programs that work best.
The visualizations help to create this understanding and to overcome the myriad false beliefs so many people have about young voters.


